Benchmarking a 10,000-Row Table: v-for, PrimeVue, and TanStack
A side-by-side benchmark of three Vue table approaches on 10,000 rows with expandable detail rows — Lighthouse, Chrome traces, and in-app metrics. The composite score and the wall-clock disagree, and the gap is where the architecture decision lives.

Optimizing a call-details page at work — long transcripts, thousands of expandable segments — the table went through four versions, each one measured before the next earned its place: a plain table, a PrimeVue DataTable, that DataTable with virtual scroll, then a headless TanStack table with virtualization. The loose end from Part 2 is what set it off: Lighthouse scores the naive table at 100, while users measure multi-second mounts and single-digit FPS. That gap bothered me enough to isolate it, so I rebuilt the comparison away from the production code — collapsing those four production steps into three implementations of the same table, measured the same way, on the same data.
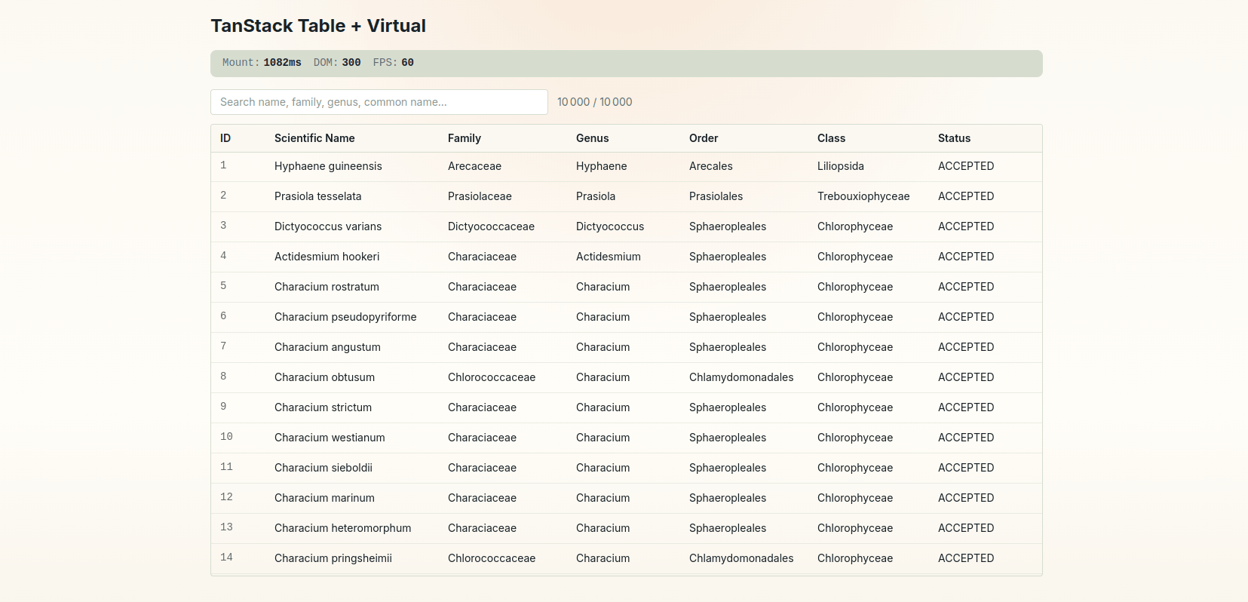
The benchmark lives in vue-jeromeabel.netlify.app/benchmark. It renders 10,000 botanical species from the GBIF taxonomy database — scientific name, family, genus, taxonomic status. When you search, matching rows expand to show vernacular names in several languages: a search for “rose” expands Rosa canina to “Dog Rose” (en), “Eglantier” (fr), “Escaramujo” (es). Master rows with expandable detail rows, at a scale that breaks the obvious approach. That’s the same shape as the Uhlive call list from Part 2: a list of calls, each expanding to its transcript.
Three numbers describe the capture conditions, and they matter for every table below: Lighthouse 13, desktop preset, 4× CPU throttling, median of 5 runs in Incognito. The 4× throttling is the important one — it’s the cheatsheet’s “test like a 4-year-old office laptop,” not like my workstation.
The baseline that scores 100 and freezes
The honest starting point is the simplest thing: render all 10,000 rows with v-for. No virtualization, no library.
<tbody>
  <template v-for="s in filteredSpecies" :key="s.key">
    <tr>
      <td class="font-mono">{{ s.benchmarkOrder }}</td>
      <td class="italic" v-html="highlight(s.canonicalName)" />
      <td v-html="highlight(s.family)" />
      <!-- ...genus, order, class, status -->
    </tr>
  </template>
</tbody>
Lighthouse, median of 5 runs:
| Metric | Value | Threshold |
|---|---|---|
| Performance Score | 100 | ≥ 90 |
| LCP | 538 ms | ≤ 2,500 ms |
| Total Blocking Time | 0 ms | ≤ 200 ms |
| DOM Size | 40 | ≤ 1,500 |
| Main-Thread Work | 7,072 ms | ≤ 2,000 ms |
Score 100. Zero blocking time. And 40 DOM nodes for a 10,000-row table. That last number is the tell. There aren’t 40 nodes — there are roughly 80,000 (10,000 rows × eight elements each). Lighthouse is reading 40 because of how the page renders:
onMounted(async () => {
  const res = await fetch("/data/species-10000.json");
  species.value = (await res.json()).map(/* ... */);
  // 80,000 nodes get created here, on the next tick
});
The component mounts as an empty shell — header, search box, empty <table>: about 40 elements. Then onMounted fires, fetches the data, and then renders 80,000 nodes. Lighthouse’s DOM-size audit samples at load, catching only the shell. The 80,000 nodes arrive after that window closes. The Largest Contentful Paint is the empty table, so LCP is a fast 538ms — it’s measuring the wrong thing.
The one Lighthouse metric that doesn’t get fooled is Main-Thread Work: 7,072 ms. That’s the only audit here built on the full trace rather than a load-time snapshot, and it fails by 3.5×. It’s the single number on this table that agrees with the user.
Two layers, because one layer lies
Three instruments measured these tables, and they don’t play the same role. Lighthouse is the scripted snapshot — a composite score sampled at load. A Chrome trace records the full timeline, the part Lighthouse stops watching once the page settles. And a live metrics panel, built into every benchmark page, runs on your machine: performance.now() around the mount (the “loading time”), a MutationObserver over a TreeWalker counting live DOM nodes, and a requestAnimationFrame loop sampling FPS.
// use-dom-metrics.ts — the panel each page mounts
markBeforeMount(); // t0 = performance.now()
// ...fetch + render...
markAfterMount(); // mount = performance.now() - t0
startObserving(tableContainer); // MutationObserver → re-walk node count on change
startFpsCounter(); // rAF tick → frames-per-second
The first two feed the numbers in this post; the third is the one you watch yourself, scrolling and filtering on your own machine.
The pipeline, and why one tool passed
The two quoted layers aren’t captured the same way, and that difference is the whole point — the live panel writes no JSON, so it sits outside this pipeline entirely. Lighthouse is scripted: pnpm benchmark:lighthouse runs each approach five times and takes the median, because a single run swings 5–15%. The trace path is manual — record a Performance profile in Chrome DevTools (4× CPU, Incognito), export the Trace-*.json, then pnpm analyze:trace && pnpm compare:trace turns it into per-second rates and a comparison table. Both layers land as JSON the /benchmark page reads live — the numbers in this post are the files those commands write, not figures I typed into a table.
And that split is why Lighthouse passed the baseline. Its DOM-size and LCP audits sample a window that closes at load — before the 80,000 nodes render on the next tick. The trace integrates the whole timeline, so Main-Thread Work and FPS see the work Lighthouse had already stopped watching. A green snapshot sitting next to a red timeline isn’t a contradiction; it’s two measurement windows onto the same page, and only one of them was open when the cost arrived.
The trace layer is where the baseline stops hiding:
| Metric (trace, 4× CPU) | Basic v-for | PrimeVue | TanStack |
|---|---|---|---|
| Scripting | 108 ms/s | 632 ms/s | 122 ms/s |
| Longest task | 139 ms | 1,017 ms | 323 ms |
| Long tasks (>50ms) | 2 | 9 | 5 |
| FPS | 0.7 | 34.7 | 50.7 |
The basic table runs at 0.7 FPS. One detail to be honest about: that isn’t a smooth-but-slow 0.7 — the trace recorded only about four frames total. The main thread is so saturated building and patching 80,000 nodes that the rAF loop barely fires. It’s not slow; it’s frozen. FPS here isn’t a clean cross-approach score so much as a yes/no on “did the page paint at all.”
Put the two layers next to each other and the story inverts: the approach with the best Lighthouse score has the worst experience.
PrimeVue: it doesn’t crash, it just costs
PrimeVue’s DataTable is the obvious upgrade, it is part of our Component libray, and virtual scroll and row expansion are one prop each.
<DataTable
  v-model:expanded-rows="expandedRows"
  :value="filteredSpecies"
  scrollable
  scroll-height="600px"
  :virtual-scroller-options="{ itemSize: 40 }"
>
  <Column expander style="width: 3rem" />
  <Column field="canonicalName" header="Scientific Name" />
  <!-- ...other columns -->
  <template #expansion="{ data }">
    <div v-for="v in matchedVernaculars(data)" :key="v.vernacularName">
      {{ v.vernacularName }} ({{ v.language }})
    </div>
  </template>
</DataTable>
Virtual scroll does its job on DOM count — 497 nodes instead of 80,000. But under real throttling, this is the approach that actually fails Lighthouse:
| Metric | Basic | PrimeVue | TanStack |
|---|---|---|---|
| Score | 100 | 77 | 97 |
| TBT | 0 ms | 534 ms | 123 ms |
| LCP | 538 ms | 823 ms | 826 ms |
| Main-Thread Work | 7,072 ms | 2,395 ms | 1,184 ms |
A 77 is a “needs improvement,” and it’s earned: 534ms of blocking time, the worst scripting cost of the three (632 ms/s), and a 1,017ms longest task — a full second where the tab can’t respond. The trace shows where it goes: 678ms inside requestAnimationFrame callbacks, the recycler re-measuring and re-positioning rows as you scroll. The 506 KB PrimeVue chunk (108 KB gzipped, versus 18 KB for the TanStack table) is part of the same bill.
This is also where PrimeVue’s architecture stops bending. In production we needed variable-height expansion rows inside the virtual scroll, and the recycler — which reuses <tr> elements as they scroll past — can’t hold dynamic heights or colspan rows (PrimeVue #3491). The benchmark uses the built-in #expansion slot, which works but constrains what an expanded row can be. When we needed full control over the expanded row’s DOM, “configure the component” ran out.
PrimeVue isn’t bad. For a uniform-row table it’s excellent and saves real work. But virtual scroll moves the cost from the DOM to the script, and a component that owns its own rows decides what you can put in them.
TanStack: headless means you own the DOM
TanStack Virtual isn’t a component — it’s a layout calculator. You give it a row count and a scroll container; it tells you which rows are visible and at what offset. You render the DOM yourself. That inversion is the whole point: the colspan expansion row that the PrimeVue recycler couldn’t hold is just markup I write.
The first move is to stop thinking in “rows with children” and flatten every row type into one array:
type FlatRow =
  | { type: "species"; data: BenchmarkedSpecies }
  | {
      type: "vernacular";
      data: { vernacularName: string; language: string };
      parentKey: number;
    };

const flattenedRows = computed<FlatRow[]>(() => {
  if (!query.value)
    return filteredSpecies.value.map((s) => ({ type: "species", data: s }));
  const rows: FlatRow[] = [];
  for (const s of filteredSpecies.value) {
    rows.push({ type: "species", data: s });
    for (const v of matched(s))
      rows.push({ type: "vernacular", data: v, parentKey: s.key });
  }
  return rows;
});
[species, vernacular, vernacular, species, ...] — row type is data, not DOM nesting. The same flattening we used for [call, segment, segment, call, ...] in production. The virtualizer estimates each row’s height by index, and — this is the Vue-specific gotcha — its options have to be a computed, or it never reacts when the data changes:
const virtualizerOptions = computed(() => ({
  count: flattenedRows.value.length,
  estimateSize: (i) =>
    flattenedRows.value[i]?.type === "vernacular" ? 32 : 40,
  getScrollElement: () => scrollContainer.value ?? null,
  overscan: 20,
}));
const virtualizer = useVirtualizer(virtualizerOptions);
TanStack’s docs pass options as a plain object because React re-runs the hook every render. Vue’s setup runs once — pass a plain object and count is captured at setup and never updates. Wrap it in computed and a search re-flattens, the virtualizer recalculates, the scroll height adjusts.
The numbers land where they should: Score 97, DOM 329 nodes, the lowest main-thread work (1,184ms) and scripting cost (122 ms/s) of the three, and 50.7 FPS during the same filter that froze the baseline. Not because TanStack is faster code — because the browser only ever holds ~20 rows.
What I Learned
- The composite score is for stakeholders, not for architecture. All three tables score 77–100. That single number hides a 245× DOM-node spread and the difference between 0.7 and 50 FPS. Track it over time; don’t make decisions with it.
- Reduce the node count first. Every other optimization is rounding error next to going from 80,000 DOM nodes to 329. The fastest node is the one you never create.
- DOM-node count is the metric that survives throttling. Score, LCP, and TBT all move with CPU speed and preset. Node count is structural — 80,000 vs 329 reads the same on any machine, and it’s the one that predicts the freeze.
- The metric you trust is the one built on the full trace. Lighthouse’s snapshot audits got fooled by an async render; Main-Thread Work (7,072ms) didn’t. When a tool reports something impossible — 40 nodes for 10,000 rows — that’s a finding, not a passing grade.
- Virtual scroll trades DOM cost for script cost. PrimeVue cut the nodes but spent it back in the recycler (534ms TBT, a 1-second task). Cheaper isn’t free.
- Headless wins when row types are mixed. A component decides what a row can be. The moment we needed variable-height, full-width expansion rows, owning the DOM was the only approach that could render them.
The benchmark runs all three side by side. Clone vue-playground, open /benchmark, and watch your own browser freeze on the basic table.